
Tracking the Shingles Shot Surge
August 14, 2025
Bhairavi Jayaraman
DatasetWhat were the state-level trends in adult vaccination coverage leading up to recent CDC/ACIP leadership changes, and which states may be most vulnerable to future declines?
Keywords
Public Health
Shingles, or herpes zoster, affects about 1 in 3 Americans over their lifetime. Though it results in fewer than 100 deaths per year, the disease can cause severe pain and long-term nerve complications, particularly among older adults. The CDC recommends that adults aged 50 and older receive two doses of the Shingrix vaccine, administered two to six months apart. Uptake of this vaccine can also serve as an indicator of how well preventive care is reaching older populations.
This issue has growing relevance in 2025, as the U.S. population ages and cost pressures increase within the healthcare system. Adults aged 65 and older are projected to double in number in number by 2040. At the same time, insurers may be re-evaluating coverage of certain adult vaccines amid shifting demand and rising skepticism. Share prices of companies with large vaccine portfolios have already declined, in part due to softening uptake of vaccines like shingles and RSV.
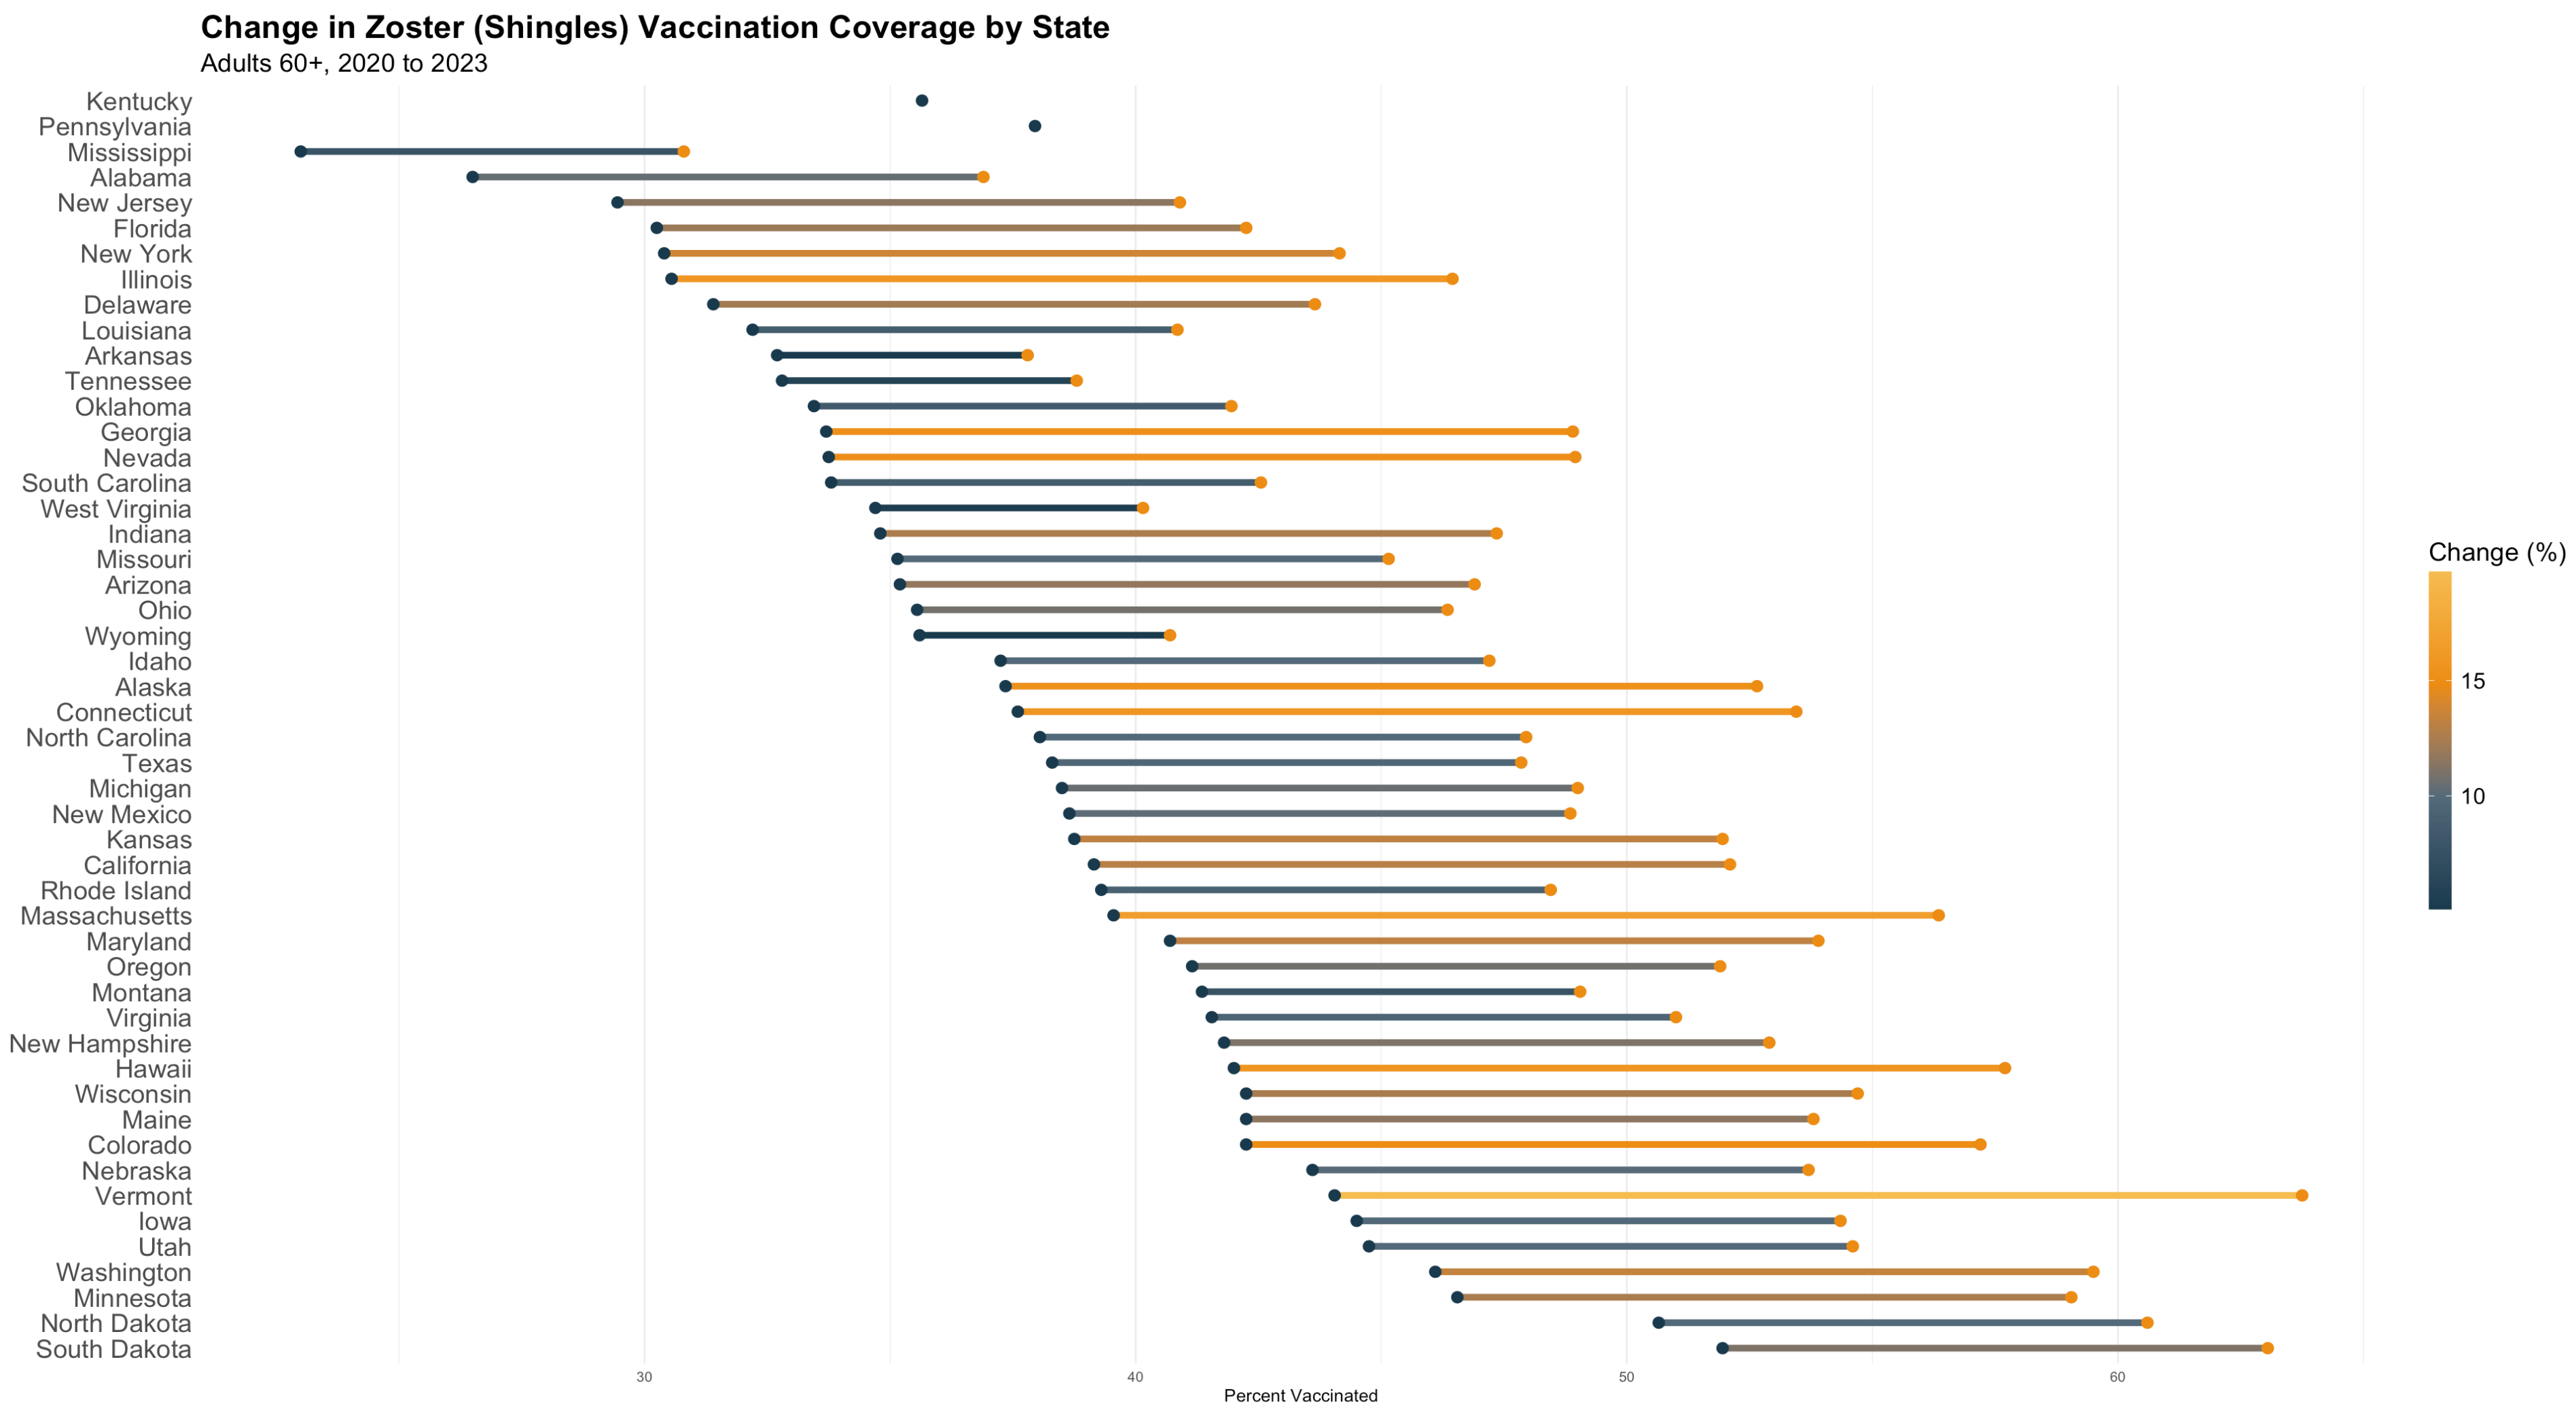
Between 2020 and 2023, shingles vaccination coverage increased in every state. This reflects a broader recovery in preventive care following disruptions caused by the COVID-19 pandemic. Most states gained several percentage points in coverage, with national rates clustering around 45% to 50% by 2023. A few states—Vermont, North Dakota, and South Dakota—stood out with rates exceeding 60%. At the other end of the spectrum, Mississippi remained below 40% in both years.
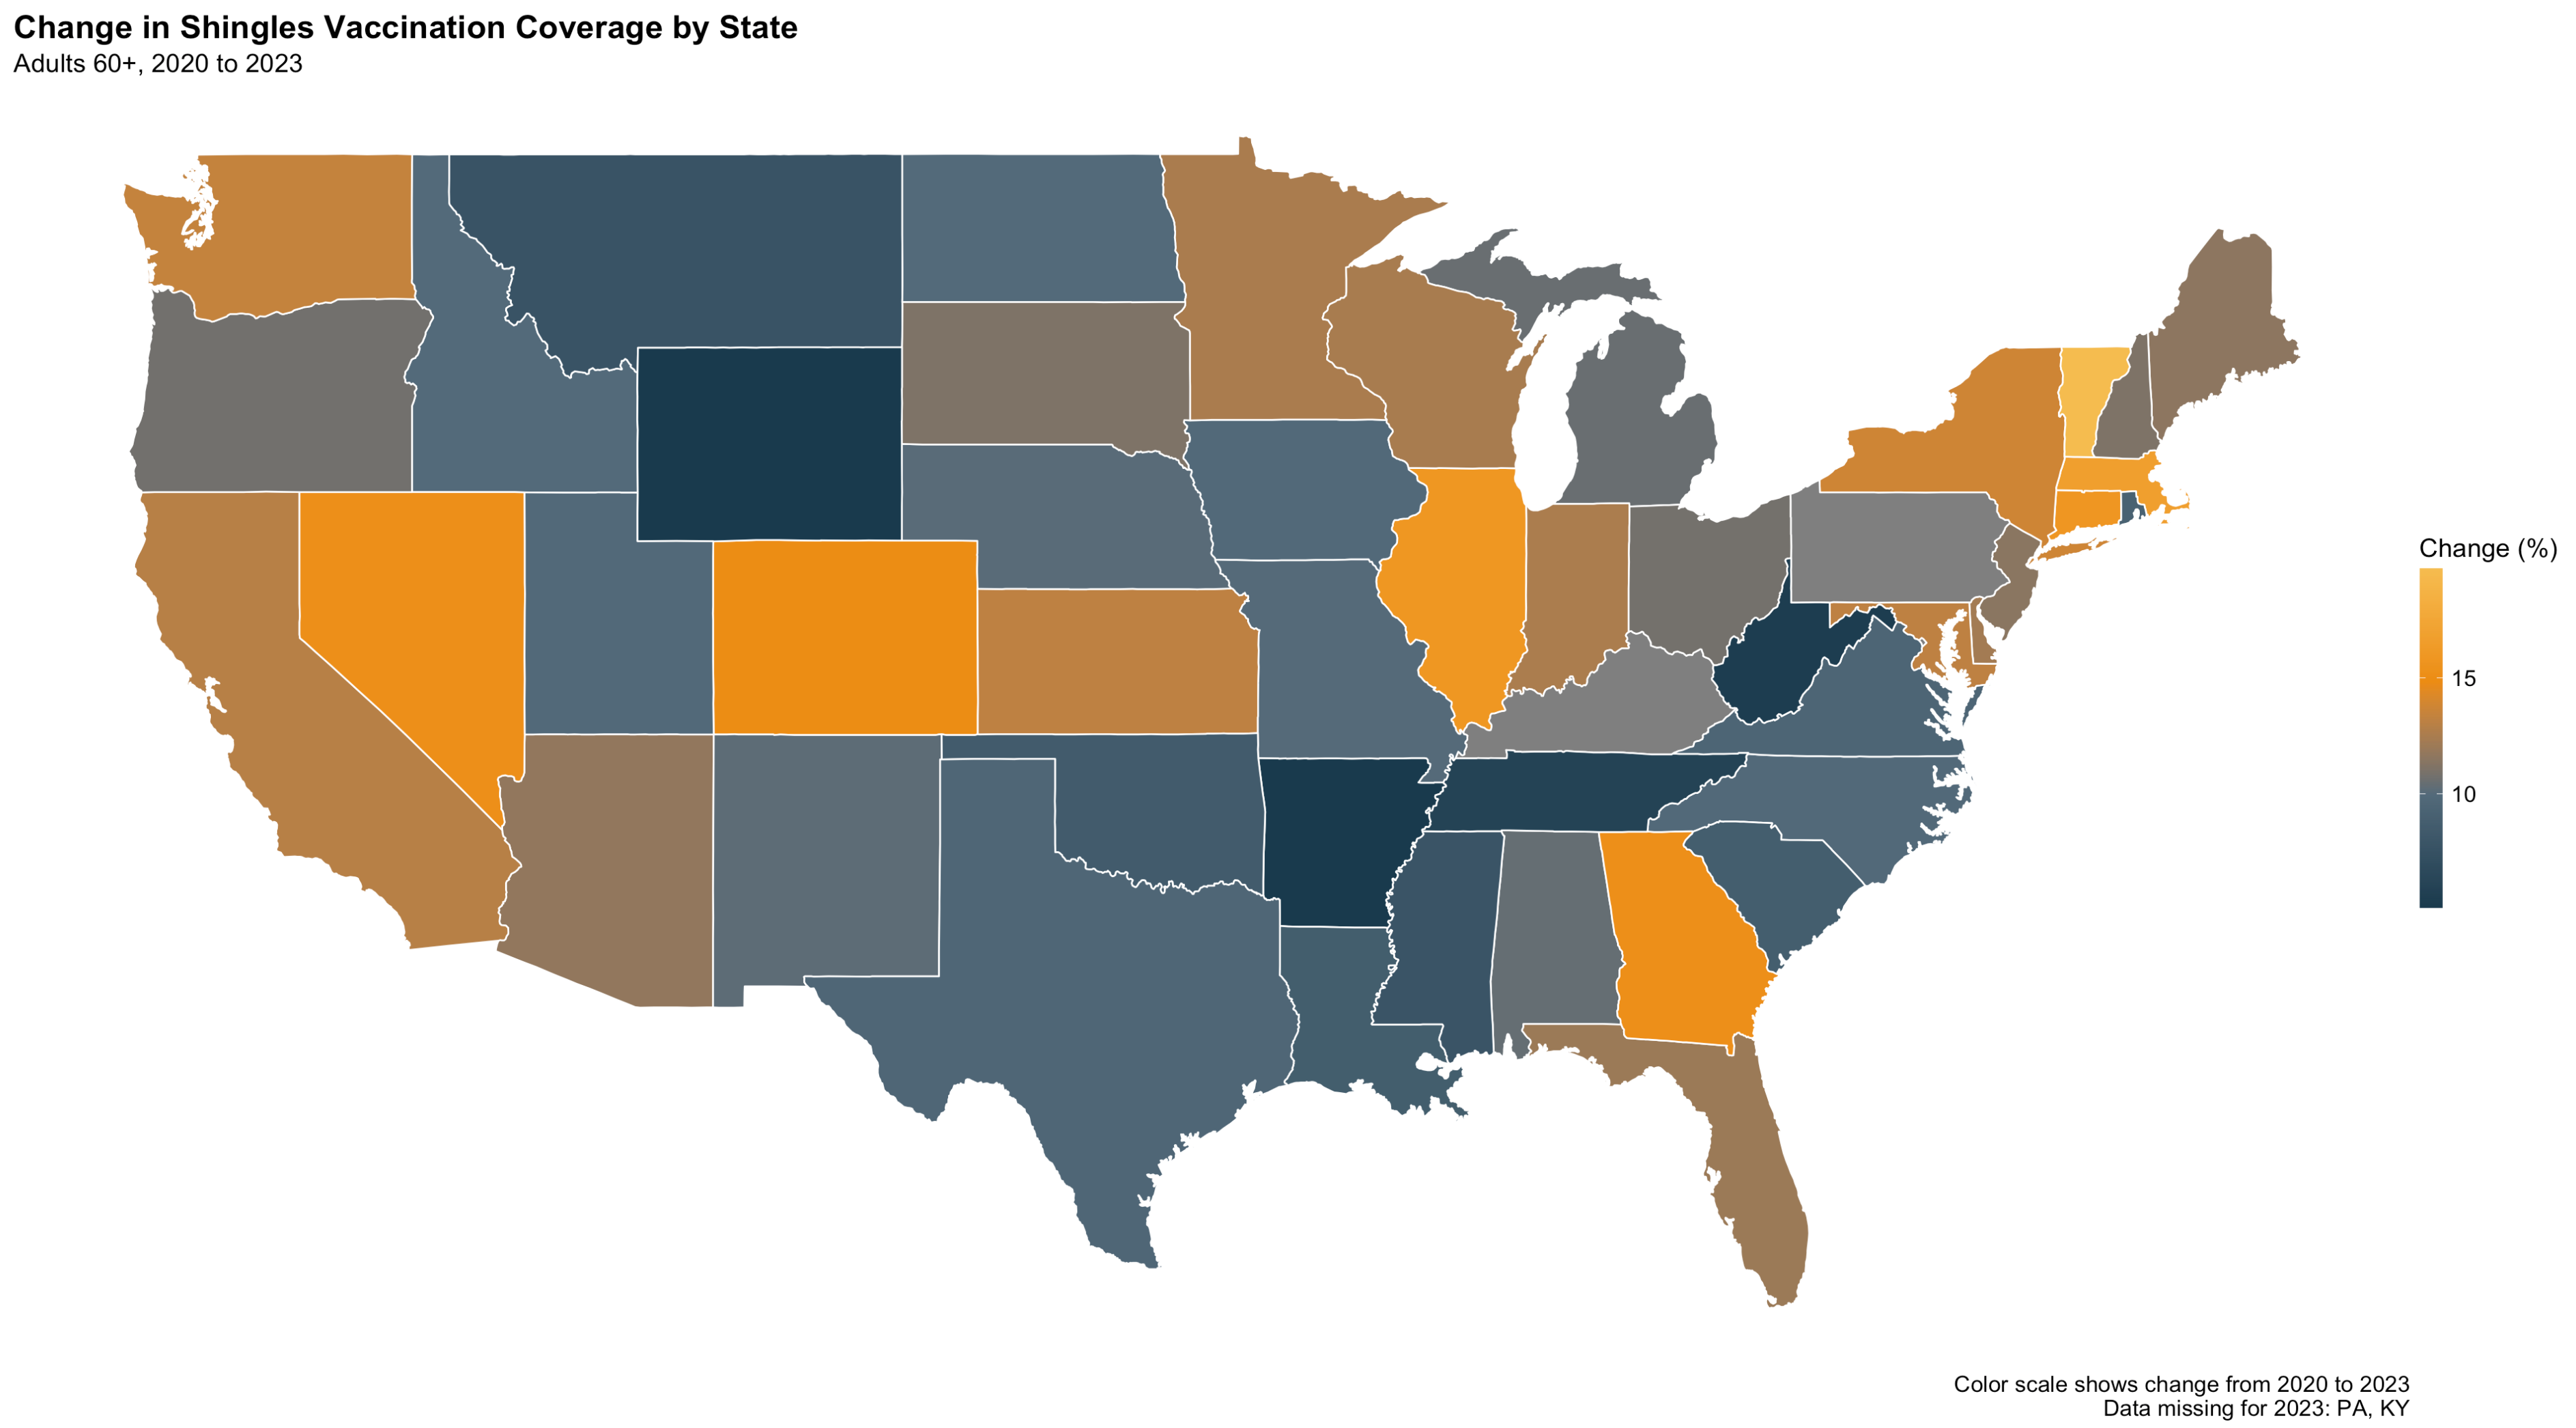
These shifts are not evenly distributed. States in the Northeastern, Upper Midwest, and Mountain West experienced the largest absolute increases. States in the South and rural West saw more limited gains. These regional patterns reflect long-standing disparities in provider access, insurance coverage, and the strength of local public health systems.
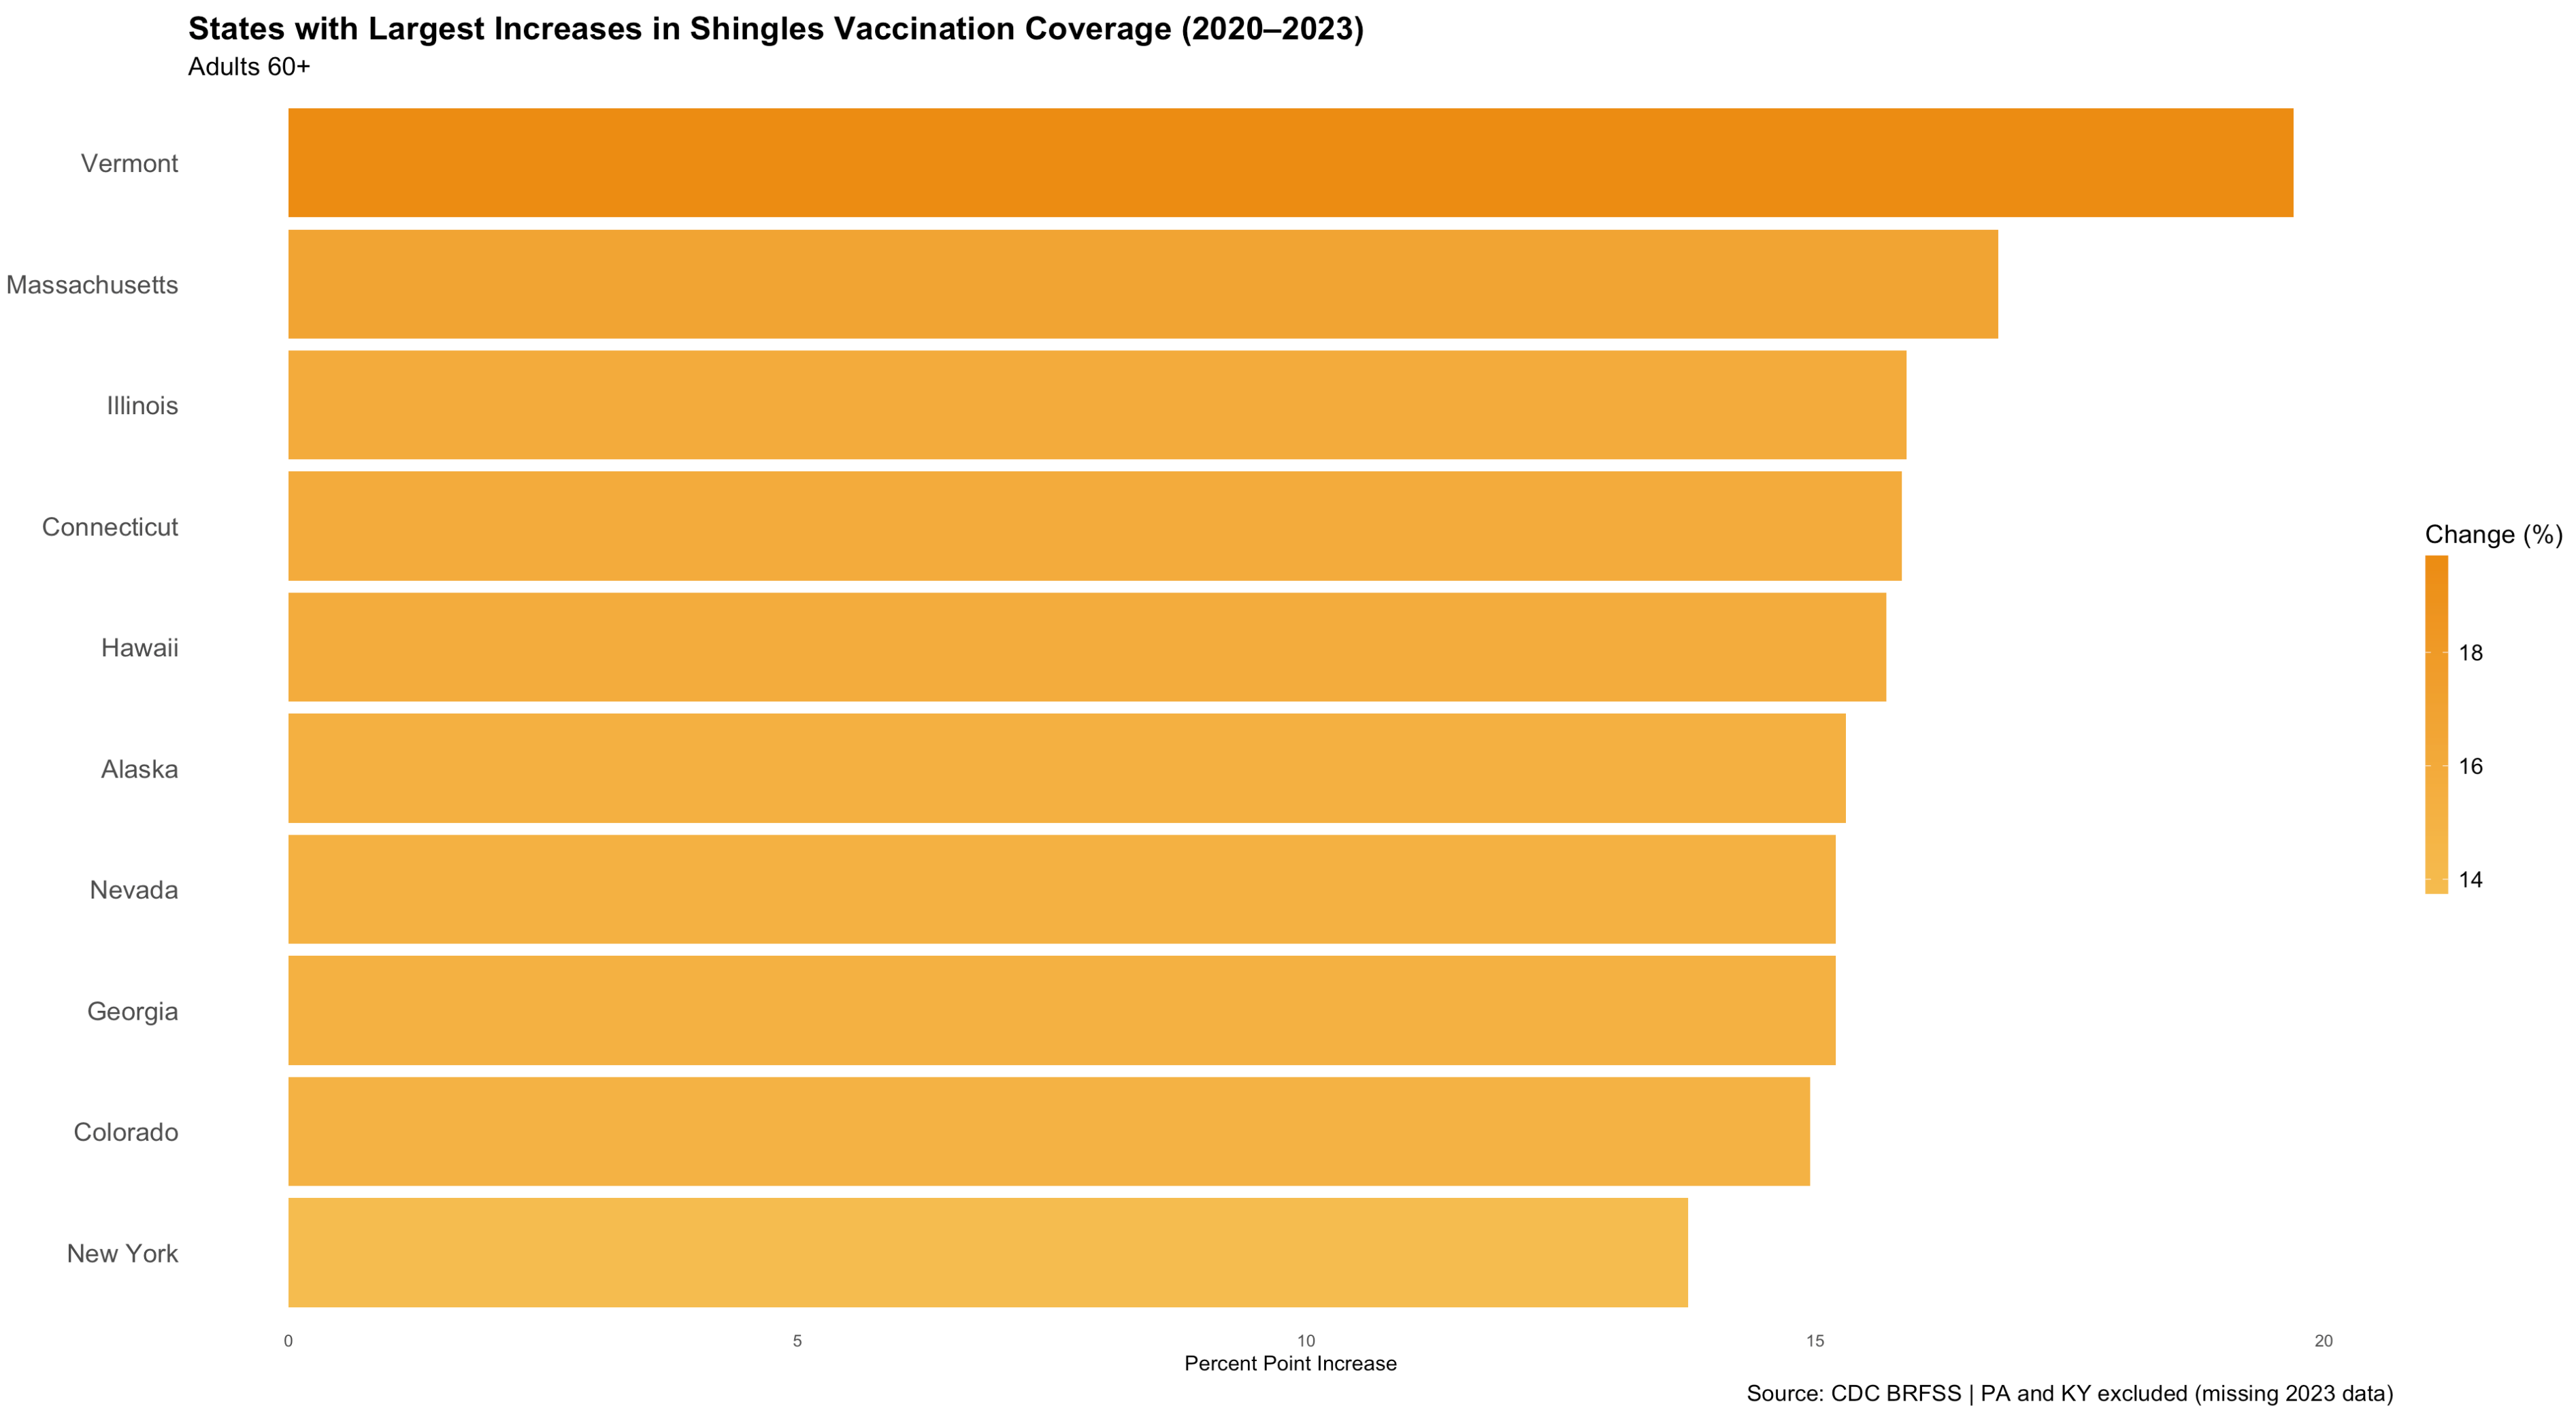
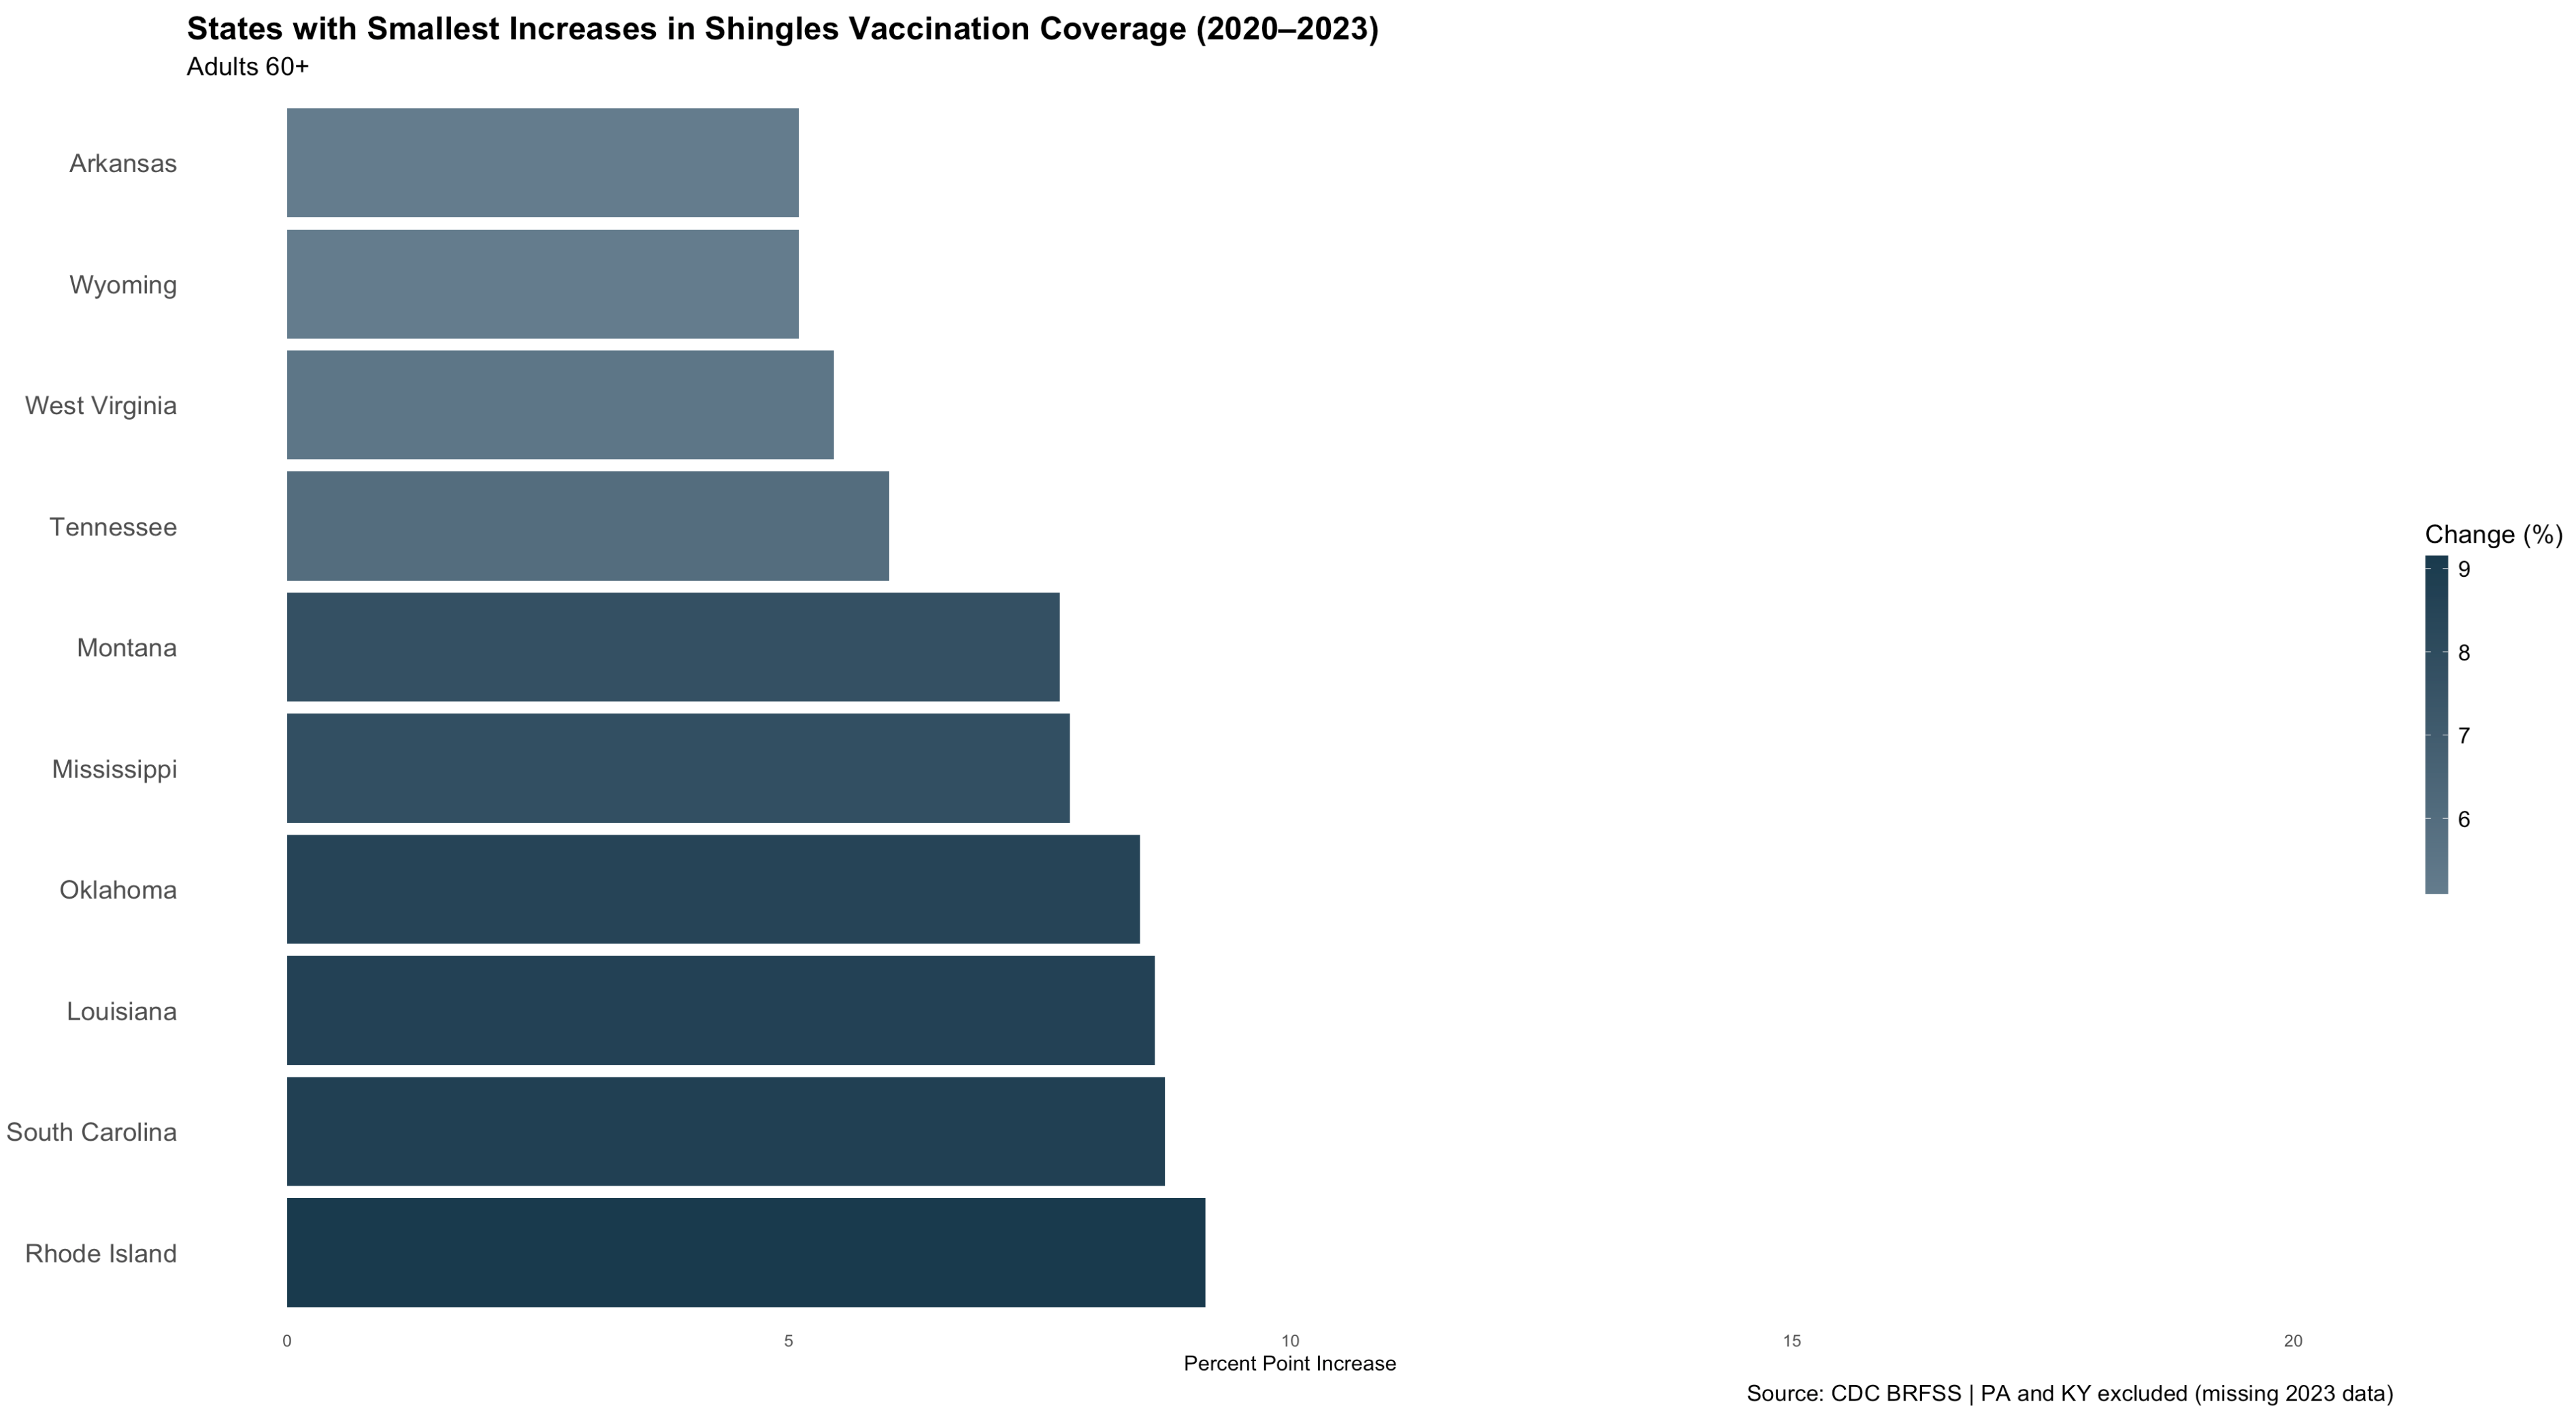
Looking at the states with the largest and smallest improvements reinforces this pattern. Vermont, Massachusetts, Illinois, and Alaska posted the most significant gains suggesting stronger infrastructure for reaching older adults and perhaps better alignment between insurers and preventive care delivery. Meanwhile, states like Mississippi and West Virginia continue to trail, likely due to a combination of structural underinvestment and limited access to regular primary care.
While national debates around vaccine mandates and agency authority persist, the more immediate threat to shingles coverage may come from market dynamics. If insurers reduce coverage for adult vaccines—especially those perceived as low-profile—the burden will likely fall hardest on states already facing gaps in access. Shingles vaccination patterns thus serve as a useful measure of where preventive care is working and where it may be vulnerable to retrenchment.
Understanding these patterns is essential. Progress from 2020 to 2023 shows what's possible, but also highlights which states may struggle to maintain coverage if the financial or political scaffolding of adult immunization erodes.
Methodology
This analysis draws on publicly available data from the CDC’s Behavioral Risk Factor Surveillance System (BRFSS), focusing on state-level adult vaccination coverage for the Zoster (Shingles) vaccine between 2020 and 2023. The dataset includes annual estimates of percent vaccinated, disaggregated by geography, age group, and race/ethnicity. The analysis was restricted to individuals aged 60 and older (including the 60–64 and 65+ age bands) and filtered to include only responses tagged as "Overall" for race/ethnicity and "States/Local Areas" for geography. Coverage estimates were averaged across respondents within each state-year. To visualize change over time, the analysis compared percent coverage in 2020 and 2023 States missing 2023 values (e.g., Pennsylvania and Kentucky) were retained for 2020 but excluded from year-over-year comparison visuals, with footnotes denoting their omission. The analysis is descriptive in nature and does not make causal claims, but it establishes a baseline to assess future changes in vaccine uptake as national policy and leadership evolve.